


Avinash Singh
Content,& Analysis,
PMS AIF WORLD
Which is better – Portfolio Management Services or Mutual Funds?
We have curated a detailed score card to analyse the performance of both. A comparison has been done between MFs and PMSs (data has been considered as of 31.03.2025 for both, and returns displayed here are net of all expenses and gross of taxes) and the infographics of the same are given below.
If you had invested INR 50 lakhs each in the basket of Top 5 Equity Mutual Funds v/s in Top 5 Portfolio Management Services over the last 1,2,3,5, and 10 Years, where would you end up?
Check out the numbers below!
For high performance investing, which is better – Portfolio Management Services or Mutual Funds?
Here we present a simple analysis to address some real questions asked by investors today – Where should you invest – Portfolio Management Services (PMS) or Mutual Funds (MF)?
While both are well regulated and credible structures meant to out-perform equity market indices, objective performance analysis conveys that it is the PMSs that have generated significantly higher alpha and so, are righty considered to be wealth-creating vehicles.
10Y Returns Comparison – Across All Categories
| TOP 5 PMSs- 10Y Returns (Across all categories) | ||
| Scheme Name | AUM (Cr) | Annualized Returns |
| Aequitas Investment India Opportunities Product | 2885.61 | 27.55% |
| Motilal Oswal Value Migration | 3232.04 | 25.00% |
| Master Trust India Growth Strategy | 339.58 | 20.42% |
| Motilal Oswal Next Trillion Dollar Opportunities (NTDOP) | 4953.83 | 19.44% |
| Girik Capital Multicap Growth Equity Strategy | 1503.58 | 18.16% |
| TOP 5 MFs- 10Y Returns (Across all categories) | ||
| Scheme Name | AUM (Cr) | Annualized Returns |
| Quant Small Cap Fund – Regular Plan – Growth | 24892.62 | 18.57% |
| SBI Small Cap Fund – Regular Plan – Growth | 308529.00 | 18.45% |
| Quant Flexi Cap Fund – Regular Plan – Growth | 6712.15 | 18.05% |
| Axis Small Cap Fund – Regular Plan – Growth | 22735.71 | 17.40% |
| Parag Parikh Flexi Cap Fund – Regular Plan – Growth | 93440.89 | 17.07% |
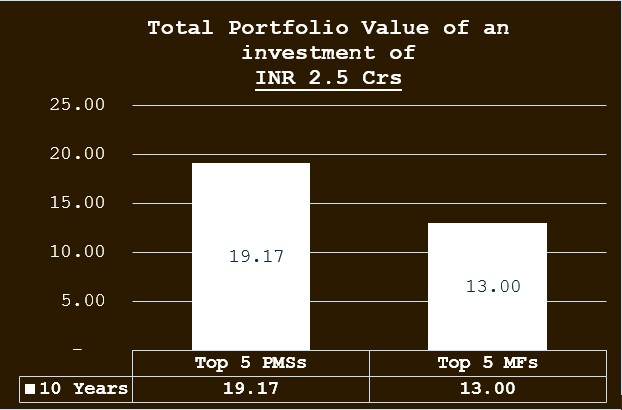
Conclusion: : If one had invested Rs 2.5 Crs in these top 5 PMSs on 1st April 2015, rather than in the top 5 MFs, over a period of 10 years, one would have generated Rs 6.17 Crs more.
5Y Returns Comparison – Flexi Cap
| TOP 5 PMSs- 5Y Returns (Flexi Cap Fund) | ||
| Scheme Name | AUM (Cr) | Annualized Returns |
| GLC Growth Fund | 899.57 | 58.05% |
| Negen Capital Special Situations PMS | 931.99 | 50.07% |
| Invasset Growth Fund | 433.83 | 43.64% |
| Buoyant Opportunities Scheme | 4330.19 | 40.19% |
| Renaissance India Next Portfolio | 442.45 | 39.28% |
| TOP 5 MFs- 5Y Returns (Regular Plan, Flexi Cap Fund) | ||
| Scheme Name | AUM (Cr) | Annualized Returns |
| Quant Flexi Cap Fund – Regular Plan Growth Option | 6712.15 | 36.84% |
| UTI Large & Mid Cap Fund – Regular Plan – Growth Option | 4789.32 | 31.22% |
| Parag Parikh Flexi Cap Fund – Regular Plan – Growth | 93440.89 | 30.31% |
| Motilal Oswal Large and Midcap Fund – Regular Plan Growth | 4100.83 | 29.92% |
| Mahindra Manulife Multi Cap Fund – Regular Plan – Growth | 4883.00 | 29.50% |
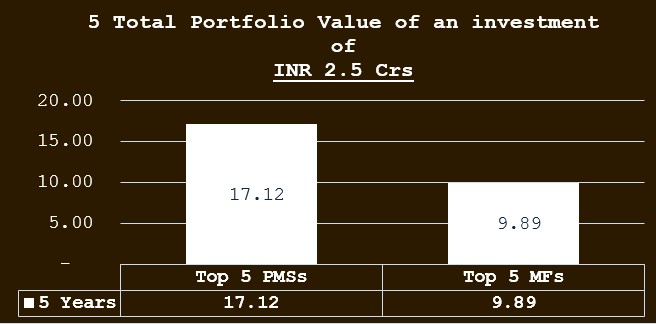
Conclusion: If one had invested Rs 2.5 Crs in these top 5 PMSs on 1st April 2020, rather than in the top 5 MFs, over a period of 5 years , one would have generated Rs 7.23 Crs more.
5Y Returns Comparison – Mid & Small Cap
| TOP 5 PMSs- 5Y Returns (Mid & Small Cap Fund) | ||
| Scheme Name | AUM (Cr) | Annualized Returns |
| Counter Cyclical Diversified Long Term Value | 582.18 | 78.20% |
| Seers Enduring Portfolio | 323.82 | 57.54% |
| Aequitas India Opportunities Product | 2885.61 | 55.74% |
| Equitree Emerging Opportunities | 612.01 | 51.76% |
| Aurum Small Cap Opportunities | 601.42 | 41.92% |
| TOP 5 MFs- 5Y Returns (Regular Plan, Mid & Small Cap Fund) | ||
| Scheme Name | AUM (Cr) | Annualized Returns |
| Bank Of India Small Cap Fund Regular Plan Growth | 1574.18 | 36.46% |
| Tata Small Cap Fund-Regular Plan-Growth | 9203.33 | 36.15% |
| Bandhan Small Cap Fund – Regular Plan Growth | 9516.16 | 35.93% |
| Canara Robeco Small Cap Fund – Regular Plan – Growth Option | 103276.82 | 35.87% |
| Edelweiss Small Cap Fund – Regular Plan – Growth | 4064.12 | 35.82% |
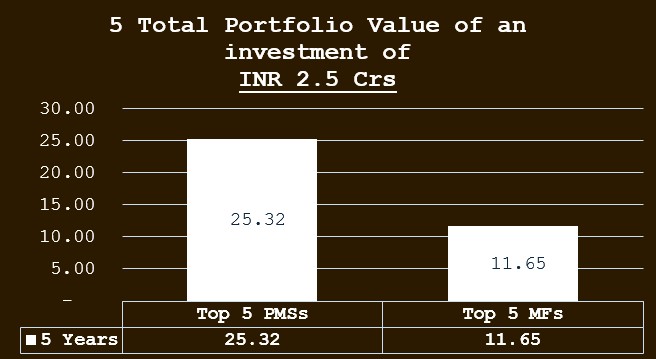
Conclusion: If one had invested Rs 2.5 Crs in these top 5 PMSs on 1st April 2020, rather than in the top 5 MFs, over a period of 5 years, one would have generated Rs 13.67 Crs more.
3Y Returns Comparison – Flexi Cap
| TOP 5 PMSs- 3Y Returns (Flexi Cap Fund) | ||
| Scheme Name | AUM (Cr) | Annualized Returns |
| Green Lantern Capital Growth Fund | 899.57 | 47.49% |
| Samvitti Capital Active Alpha | 363.06 | 33.80% |
| Stallion Asset Core Fund | 4494.5 | 32.27% |
| Invasset Growth Fund | 433.83 | 30.90% |
| HDFC Diversified Equity | 557.56 | 25.92% |
| TOP 5 MFs- 3Y Returns (Regular Plan, Flexi Cap Fund) | ||
| Scheme Name | AUM (Cr) | Annualized Returns |
| SBI Long Term Equity Fund – Regular Plan – Growth | 27730.33 | 23.29% |
| Motilal Oswal Large and Midcap Fund – Regular Plan Growth | 4100.83 | 22.86% |
| Kotak Multicap Fund – Regular Plan – Growth | 15870.00 | 21.23% |
| Bandhan Core Equity Fund – Regular Plan – Growth | 7966.79 | 21.20% |
| JM Flexicap Fund (Regular) – Growth Option | 5263.18 | 20.96% |
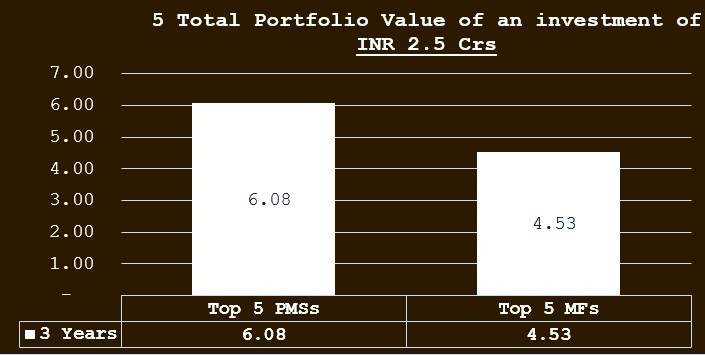
Conclusion: If one had invested Rs 2.5 Crs in these top 5 PMSs on 1st April 2022, rather than in the top 5 MFs, over a period of 3 years, one would have generated Rs 1.55 Crs more.
3Y Returns Comparison – Mid & Small Cap
| TOP 5 PMSs- 3Y Returns (Mid & Small Cap Fund) | ||
| Scheme Name | AUM (Cr) | Annualized Returns |
| Aequitas India Opportunities Product | 2885.61 | 37.01% |
| Equitree Emerging Opportunities | 612.01 | 36.79% |
| Counter Cyclical Diversified Long Term Value | 582.18 | 30.78% |
| Seers Enduring Portfolio | 323.82 | 28.45% |
| Carnelian Shift Strategy | 3410.34 | 28.08% |
| TOP 5 MFs- 3Y Returns (Regular Plan, Mid & Small Cap Fund) | ||
| Scheme Name | AUM (Cr) | Annualized Returns |
| Bandhan Small Cap Fund – Regular Plan Growth | 9516.16 | 23.94% |
| ITI Small Cap Fund – Regular Plan – Growth Option | 3219 | 23.30% |
| Invesco India Small Cap Fund – Regular Plan – Growth | 5885 | 20.72% |
| Edelweiss Mid Cap Fund – Regular Plan – Growth Option | 8633.85 | 21.94% |
| Tata Small Cap Fund-Regular Plan-Growth | 9203.23 | 21.11% |
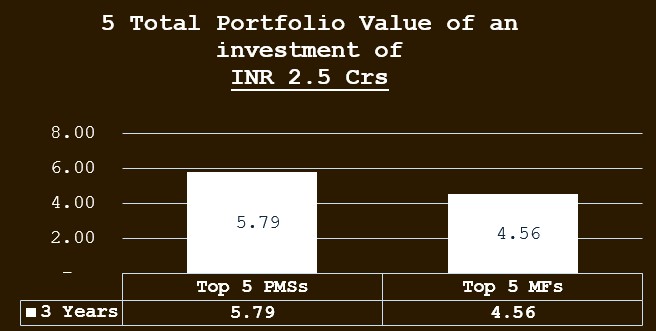
Conclusion: If one had invested Rs 2.5 Crs in these top 5 PMSs on 1st April 2022, rather than in the top 5 MFs, over a period of 3 years, one would have generated Rs 1.23 Crs more.
2Y Returns Comparison – Flexi Cap
| TOP 5 PMSs- 2Y Returns (Flexi Cap Fund) | ||
| Scheme Name | AUM (Cr) | Annualized Returns |
| Green Lantern Capital Growth Fund | 899.57 | 62.03% |
| Invasset Growth Fund | 433.83 | 55.67% |
| Stallion Asset Core Fund | 4494.5 | 52.73% |
| Samvitti Active Alpha | 363.06 | 45.55% |
| Ambit Alpha Growth Portfolio | 581.34 | 44.68% |
| TOP 5 MFs- 2Y Returns (Flexi Cap Fund) | ||
| Scheme Name | AUM (Cr) | Annualized Returns |
| SBI Long Term Equity Fund – Regular Plan- Growth | 27730.33 | 32.43% |
| Motilal Oswal Large and Midcap Fund – Regular Plan Growth | 4100.83 | 31.30% |
| Bandhan Core Equity Fund – Regular Plan – Growth | 7966.79 | 30.74% |
| Kotak Multicap Fund-Regular Plan-Growth | 15870.00 | 30.07% |
| JM Flexicap Fund (Regular) – Growth Option | 5263.18 | 29.82% |
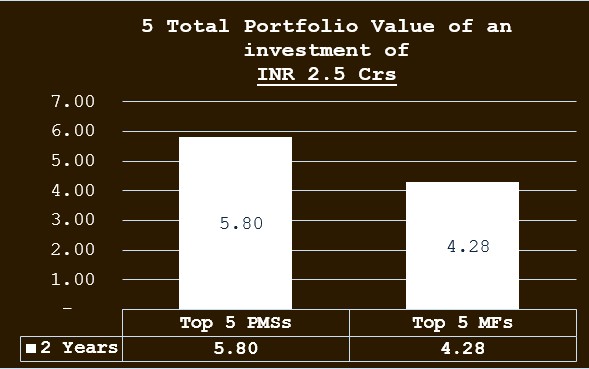
Conclusion: If one had invested Rs 2.5 Crs in these top 5 PMSs on 1st April 2023, rather than in the top 5 MFs, over a period of 2 years, one would have generated Rs 1.52 Crs more.
2Y Returns Comparison – Mid & Small Cap
| TOP 5 PMSs- 2Y Returns (Mid & Small Cap Fund) | ||
| Scheme Name | AUM (Cr) | Annualized Returns |
| Equitree Emerging Opportunities | 612.01 | 61.88% |
| Aequitas India Opportunities Product | 2885.61 | 46.48% |
| Carnelian Shift Strategy | 3410.34 | 43.18% |
| Seers Enduring Portfolio | 323.82 | 40.99% |
| Roha Emerging Champions Portfolio | 310.71 | 37.16% |
| TOP 5 MFs- 2Y Returns (Regular Plan, Mid & Small Cap Fund) | ||
| Scheme Name | AUM (Cr) | Annualized Returns |
| Bandhan Small Cap Fund – Regular Plan Growth | 9516.16 | 41.75% |
| ITI Small Cap Fund – Regular Plan – Growth | 3219.00 | 33.68% |
| Edelweiss Mid Cap Fund – Regular Plan – Growth | 8633.85 | 32.80% |
| Mahindra Manulife Mid Cap Fund – Regular Plan – Growth | 3398.00 | 32.37% |
| Invesco India Smallcap Fund – Regular Plan – Growth | 5884.64 | 31.72% |
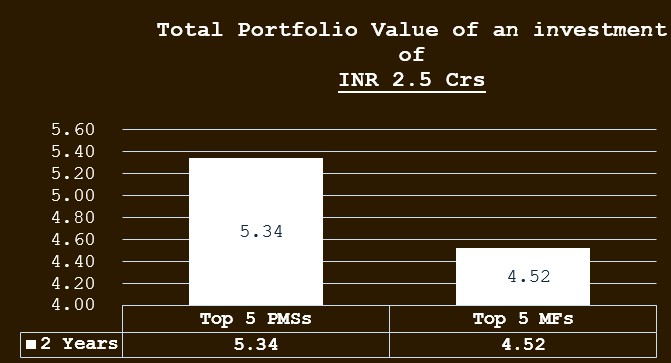
Conclusion:If one had invested Rs 2.5 Crs in these top 5 PMSs on 1st April 2023, rather than in the top 5 MFs, over a period of 2 years, one would have generated Rs 0.82 Crs more.
1Y Returns Comparison – Flexi Cap
| TOP 5 PMSs- 1Y Returns (Flexi Cap Fund) | ||
| Scheme Name | AUM (Cr) | Annualized Returns |
| Stallion Asset Core Fund | 4494.5 | 30.57% |
| GLC Growth Fund | 899.57 | 24.62% |
| InCred Multicap Portfolio | 280.8 | 21.73% |
| Anand Rathi Impress Portfolio | 534.87 | 20.88% |
| HDFC Diversified Equity | 351.8 | 20.21% |
| TOP 5 MFs- 1Y Returns (Regular Plan, Flexi Cap Fund) | ||
| Scheme Name | AUM (Cr) | Annualized Returns |
| Motilal Oswal Large Cap Regular Plan – Growth | 1919.37 | 25.11% |
| Motilal Oswal Flexi Cap Fund Regular Plan – Growth | 12266.94 | 18.45% |
| DSP Equity Opportunities Fund-Regular Plan – Growth | 13784.25 | 15.98% |
| SBI Multicap Fund- Regular Plan- Growth – Option | 19192.41 | 15.48% |
| LIC MF Large & Mid Cap Fund-Regular Plan – Growth | 3141.81 | 15.28% |
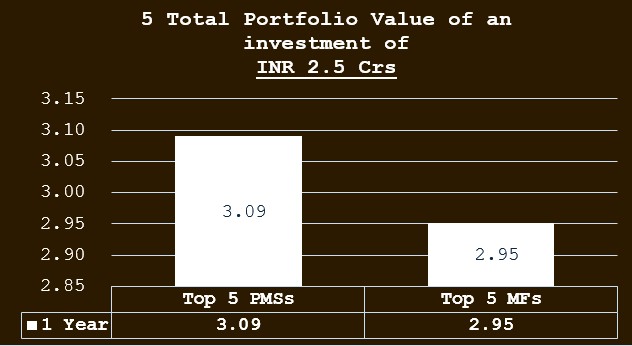
Conclusion: If one had invested Rs 2.5 Crs in these top 5 PMSs on 1st April 2024, rather than in the top 5 MFs, over a period of 1 year, one would have generated Rs 0.14 Crs more.
1Y Returns Comparison – Mid & Small Cap
| TOP 5 PMSs- 1Y Returns (Mid & Small Cap Fund) | ||
| Scheme Name | AUM (Cr) | Annualized Returns |
| Equitree Emerging Opportunities | 612.01 | 38.26% |
| Carnelian Shift Strategy | 3410.34 | 18.20% |
| Abakkus Emerging Opportunities Approach | 4859.25 | 17.94% |
| Aequitas India Opportunities Product | 2885.61 | 17.41% |
| Electrum Laureate Portfolio | 476.24 | 17.02% |
| TOP 5 MFs- 1Y Returns (Regular Plan, Mid & Small Cap Fund) | ||
| Scheme Name | AUM (Cr) | Annualized Returns |
| Bandhan Small Cap Fund – Regular Plan Growth | 9516.16 | 18.52% |
| Edelweiss Mid Cap Fund – Regular Plan – Growth Option | 3219.00 | 17.58% |
| Invesco India Smallcap Fund – Regular Plan – Growth | 5884.64 | 13.26% |
| Tata Small Cap Fund-Regular Plan-Growth | 9203.23 | 11.84% |
| ITI Small Cap Fund – Regular Plan – Growth Option | 3219.00 | 9.82% |
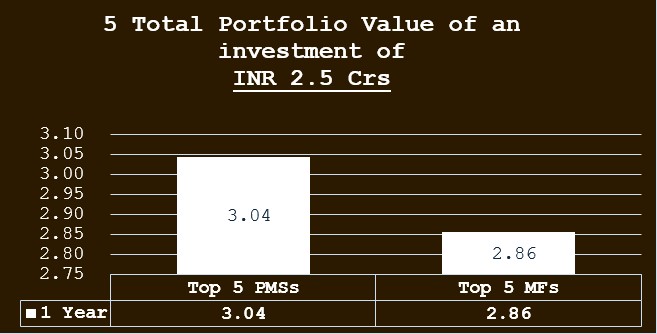
Conclusion: If one had invested Rs 2.5 Crs in these top 5 PMSs on 1st April 2024, rather than in the top 5 MFs, over a period of 1 year, one would have generated Rs 0.18 Crs more.
Wish to make INFORMED INVESTMENTS for Long Term WEALTH CREATION

